
Desktop
Phone
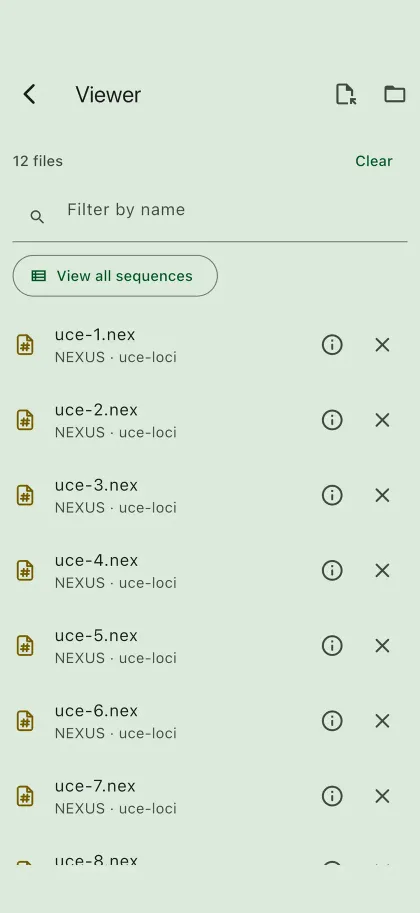
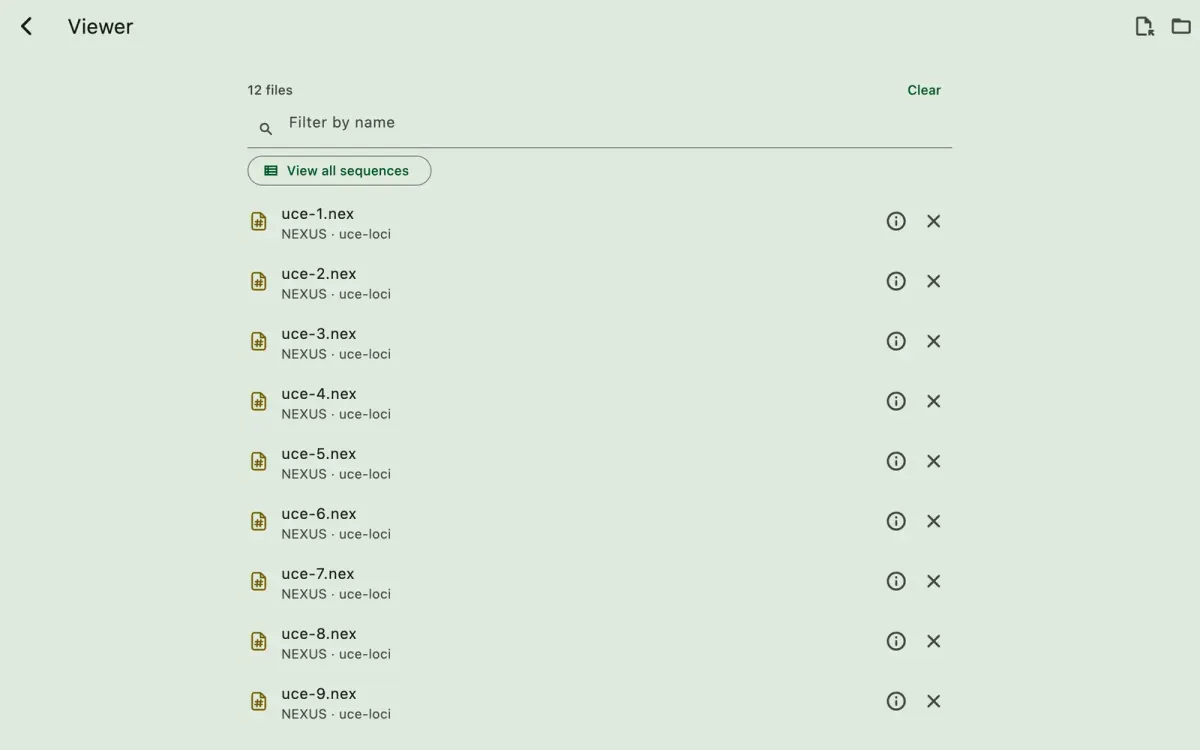
SEGUI opens alignments, tables, reports, and text files in built-in viewers. Use the Viewer page to open files just to look at them, without picking a tool first. It works like segul view in the CLI.
You can also open a file from a tool's Input or Output tab, or from the inspector in the Workbench tab. On desktop, the menu (⋮) next to an output file can open it in another app instead, which also works for file types SEGUI cannot show.
Supported files
Section titled “Supported files”- Sequence files in FASTA, NEXUS, or PHYLIP format, which open in the alignment viewer
- Comma-separated values (
.csv), which open in the table viewer - Summary reports:
alignment-report.json,distance-report.json, andread-report.json, which open as summary reports - NEXUS partition files, plain text (
.txt), and log files, which open as text
Compressed files, such as .fastq.gz reads, and archives are not listed in the Viewer.
Viewer page
Section titled “Viewer page”On phones, open the Viewer from More in the navigation bar. On larger screens, select Viewer in the side menu, or the eye button at the bottom of the rail.
Open files
Section titled “Open files”Select Open file or Open folder at the top of the page A. When the page is empty, the same choices are in the box in the middle. Opening a single file shows it right away.
A folder adds the files SEGUI can view directly inside it. Subfolders are not searched, as with segul view align --dir. On desktop, you can also drop files and folders onto the page. Opening more files adds them to the list, and files already listed are skipped.
File list
Section titled “File list”The list B shows each file's name, format, and folder, in natural order, so uce-2 comes before uce-10.
- Open: tap a file to open it in its viewer. Alignments step through the other alignments in the list, so you can browse a folder of loci without going back.
- View all sequences: opens the alignment viewer on the first alignment in the list C.
- Details: the info button D shows a file's format, size, and counts, such as the number of sequences and sites.
- Filter: when the list has nine or more files, type in
Filter by nameto narrow it. - Remove and clear: the × button removes one file from the list, and
Clearremoves them all. Files stay on your device.
Recent files
Section titled “Recent files”When the list is empty, the page shows up to ten files and folders you opened recently, newest first. Tap one to open it again, or select × to remove it from the list. Clear removes them all.
Alignment viewer
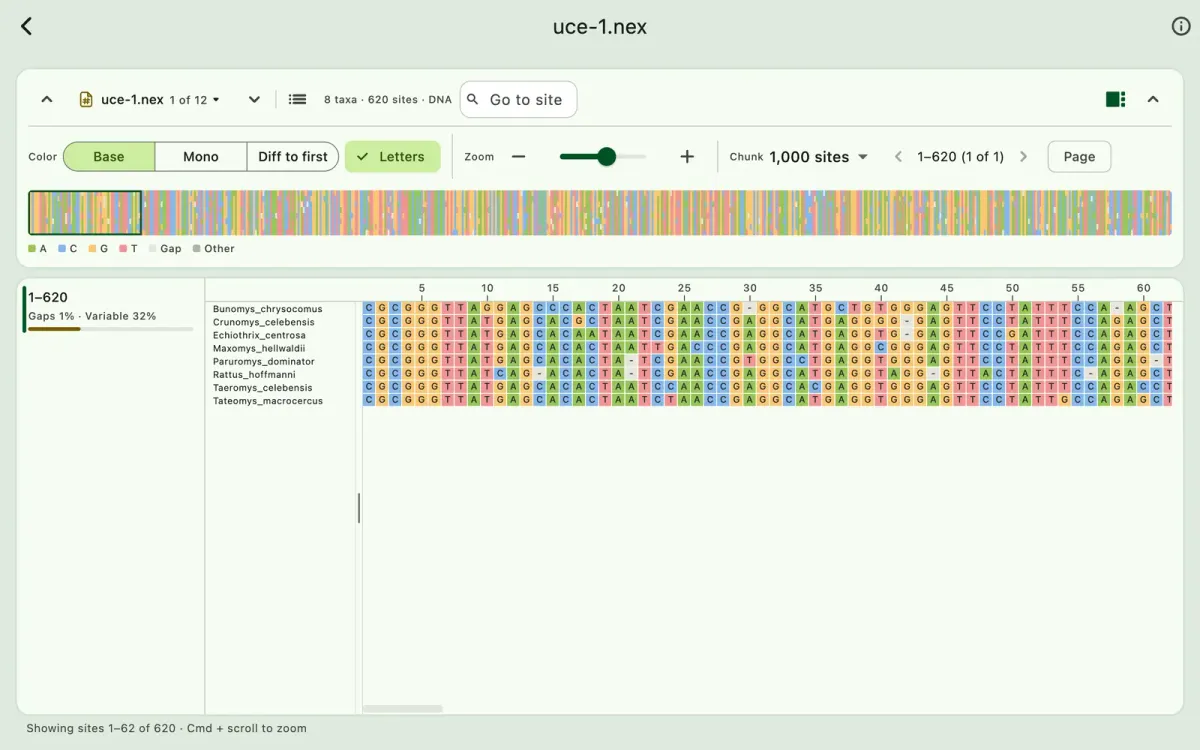
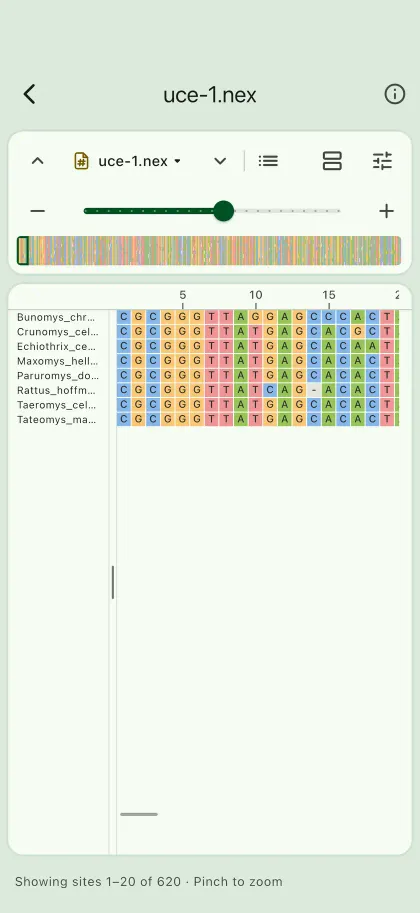
Section titled “Alignment viewer”FASTA, NEXUS, and PHYLIP files open in the alignment viewer. NEXUS partition files, which hold only a sets block of charsets, open as text instead, and the viewer leaves them out when it switches between files. It draws only the part of the alignment on screen, so alignments of 10,000 sites or more scroll smoothly. Taxon names stay pinned on the left and site numbers on the top.
- Switch files: when you open a file from the Viewer or a tool's input or output list, the viewer can move between the other alignment files in that list without going back. The file switcher E sits at the start of the header. Use its arrows, press
Alt+↑or↓(Optionon macOS), or click the file name to search for a file. Files are listed in natural order, souce-2comes beforeuce-10. Select the list button at the end of the switcher to show every file beside the viewer. Filter it by name, and use the sort button in the filter box to sort by name or size, in either direction. On phones, the list opens as a sheet. Zoom, colors, chunk size, and the name panel width stay the same when you switch. Selected sequences and the current chunk reset. - Hide settings: select the arrow at the right of the header G, or press
Ctrl+\(Cmd+\on macOS), to hide the color, zoom, and chunk controls, the overview, and the legend. The grid takes the freed space, while the file name, summary, andGo to sitestay in the header. Select the settings button or press the shortcut again to bring them back. - On phones: the header keeps the file, zoom, and overview in view, and only the grid scrolls. Select the settings button G for colors, chunks,
Go to site, and the legend, or the chunks button for the chunk list; both open as sheets. Pinch the grid to zoom. Tap a cell to see its details at the bottom. When sequences are selected, tapN selectedat the bottom for their actions. - Colors:
Basecolors nucleotides (A green, C blue, G amber, T red) or amino acids by chemistry.Monoshows residues in one color, which makes gaps easy to spot.Diff to firstgrays out residues that match the first sequence, so only the differences stand out. - Zoom: use the zoom buttons or slider, or hold
Ctrl(Cmdon macOS) and scroll. When zoomed out, letters are hidden and each site becomes a colored block. SelectLettersto hide or show residue letters. - Overview: the strip above the grid F shows the whole alignment. The outlined box marks what is on screen. Tap or drag the strip to jump to another part.
- Chunks: the alignment is split into chunks of 250 to 2,000 sites (
Chunkin the toolbar). The chunk list on the left shows each chunk's share of gaps and variable sites, so you can find informative or gappy regions fast. Select a chunk, or use the arrows, to move between chunks. Turn onPageto show one chunk at a time. - Go to site: enter a site number to jump to it.
- Details: hover over or select a cell to see the taxon, site, ungapped position, and residue below the grid.
- Name panel: drag the divider between the names and the grid to resize the names. Double-click it to reset the width.
- Select sequences: click a name to select its sequence. Hold
Shiftto select a range, orCtrl(Cmdon macOS) to add or remove one. Selected sequences are highlighted in the grid, and the overview dims the rest. Below the grid, chooseCopy as FASTAto copy them,Only selectedto hide the others, orPin to topto move them above the rest. WhenDiff to firstis on, residues are compared with the top sequence, so you can pin a sequence to use it as the reference. SelectClearto deselect all. On phones, tap names to add or remove them, then tapN selectedat the bottom for these actions.
Table viewer
Section titled “Table viewer”CSV files, such as the locus, taxon, contig, and MAF summaries, open in a table. Numbers use a thousands separator and up to two decimals (for example, 1,000 and 0.65).
- Sort: select a column heading to sort by it. Select it again to reverse the order. The arrow next to the heading shows the direction. Names sort naturally, so
locus_2comes beforelocus_10. - Resize: drag the handle at the right edge of a text column heading, such as a sample or locus name, to make the column wider or narrower. Double-click the handle (double-tap on a touch screen) to reset the width.
- Pages: large tables show 50 rows at a time. Choose 50, 100, 250, or 500 under
Rows per page, and move between pages with the arrows below the table. Sorting starts again from the first page. - Bars in cells: in columns of numbers, a bar behind each value shows where it sits between the lowest and highest value of the column, so you can spot unusually short loci or gappy taxa while scrolling. Columns where every row has the same value show no bars.
- Scrolling: the column headings and the page controls stay in place while the rows scroll. Wide tables scroll sideways, and the row scrollbar stays at the right edge of the table.
Summary reports
Section titled “Summary reports”Summary tools write a report that SEGUI opens as interactive charts and tables:
- Alignment report from
Summarize alignments. - Read report from the Complete mode of
Summarize genomic reads. - Distance report from
Compute genetic distances.
Open a report from the Report card in the Workbench tab after a run, or open its JSON file from the Output tab or the inspector later. The other summary tools, such as contig and MAF summaries, write CSV files that open in the table viewer.
The reports work the same way:
- Tabs: each report is split into tabs, such as
Overview,Loci, andDistributions. Select a tab to switch. - Bars, Table, and Heatmap: tabs that list items, such as loci, taxa, or samples, show one statistic per item as
Bars, or every statistic as aTableor aHeatmap. Light lines separate the table columns, and the heatmap colors each number from the lowest to the highest value in its column. Choose the statistic with the chips above the bars. Select a bar or a row to open that item. - Fixed controls: the controls stay at the top and the open item's values stay at the bottom, while the bars or rows scroll between them. On phones and short windows, the whole tab scrolls instead.
- Tables: the same table as the table viewer, sortable by column, a page at a time, with a bar behind each number. The open item's row is highlighted, and the table turns to its page when you open another item.
- Charts: hover over or touch a chart to see its values. Zoom along the horizontal axis with the mouse wheel or a pinch, and drag or scroll with a trackpad to pan. A reset button appears at the top right of a zoomed chart; select it to show the whole chart again.